Overview
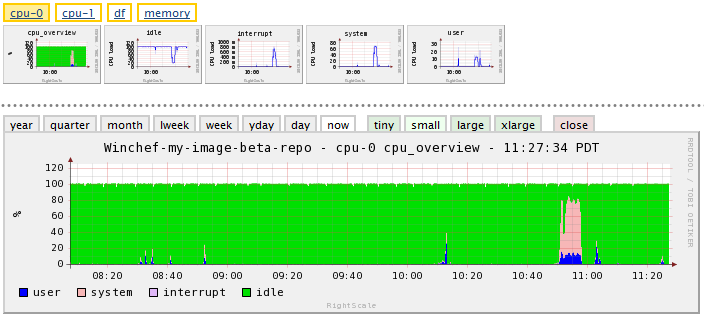
RightScale supports basic monitoring of Windows servers. By default, the following metrics are monitored:
- cpu (overview, idle, interrupt, system, user)
- memory (free memory)
- disk (used space, free space)

Additional metrics are provided by the Chef recipes in the 'sys_monitoring' cookbook. (Ex: add_iis_stats, add_process_stats, etc)
- iis (overview, idle, interrupt, system, user)
- process (process count, thread count)
- file (file age, file size)
- sql server
View a Windows Server with Monitoring
The easiest way to see a Windows server with monitoring enabled is to launch a server using one of our All-In-One ServerTemplates. If you have a different AMI that you want to enable for monitoring so that you can see its graphs in the RightScale Dashboard, follow the instructions below.
Enabling Monitoring on a Windows Server
Follow the steps below to enable monitoring on a Windows server.
- The first step is to RightScale-enable an existing Windows AMI by following the Getting Started with RightLink guide.
- Create a MultiCloud Image (MCI) that references your RightLink-enabled Windows AMI(s).
- Create a ServerTemplate.
- Be sure to select the Windows MCI that you just created.
- In order to enable monitoring on a Windows server you need to have access to the
SYS Monitoring installPowerShell RightScript orsys_monitoring::defaultChef recipe. Import the WindowsASP.NET All-In-One Developer
ServerTemplate from the MultiCloud Marketplace (published by RightScale) so that theRightScale Public Windows
RepoPath object is effectively imported. Alternatively, you can create a new RepoPath with the Cookbook Repos, git://github.com/rightscale/cookbooks_public_windows. Under the cookbook repository ensure you have set the cookbooks path tocookbooksand set the Tag/Branch to92649d6dc012f36e538b2889f3eb06fd88064ccd. - Under the Server's Scripts tab, add the
SYS Monitoring installPowerShell RightScript or thesys_monitoring::defaultChef recipe from the 'sys_monitoring' cookbook as a Boot Script.
- Launch the Server.
Custom Windows Monitoring
RightScale supports basic monitoring of Windows servers. If you launch servers using one of our published Windows ServerTemplates (that's leveraging v5.5 RightImages and above), basic monitoring is installed by default. If you're new to RightScale and are launching Windows servers for the first time through the RightScale Dashboard, the best way to see real-time monitoring is to launch servers using one of the All-In-One
ServerTemplates.
If you want to extend the basic monitoring functionality that's supported for Windows servers, you can create your own custom monitoring plugins so that additional metrics can be monitored and their graphs can be displayed in the Dashboard.
There are two different ways to customize Windows monitoring: