Overview
This tutorial is useful for testing a custom monitoring plugin, but if you want the plugin to be usable by ServerTemplates so that your custom graphs will always be displayed in future launches of Windows servers, you will need to use RightScripts and/or Chef Recipes. See Add a Custom Monitoring Plugin Automatically with RightScripts or Chef Recipes.
Use the procedure outlined below to extend monitoring on Windows servers by manually adding custom monitoring plugins directly on a running server so that additional metrics are monitored and graphed inside the RightScale Dashboard.
Prerequisites
- 'actor' and 'server_login' user role privileges
Steps
Launch a Windows Server
For the purpose of this tutorial, we recommend launching a Windows server with a ServerTemplate.
Once you have an operational Windows server, proceed to the next step.
RDP into the Server
When viewing the running Server's show page, click on its RDP action button to create a Remote Desktop Connection to the running instance. Remember, you must use an Internet Explorer browser window to perform this action and the instance's security group must have port 3389 open.
Identify the WMI Metric to Graph
Let's assume you want graph the 'InterruptsPersec' metric from the 'Win32_PerfFormattedData_PerfOS_Processor' WMI class. To verify the select statement, run this command in a PowerShell window:
PS C:\> Get-WmiObject -Query "Select InterruptsPersec from Win32_PerfFormattedData_PerfOS_Processor where Name='_Total'"

__GENUS : 2
__CLASS : Win32_PerfFormattedData_PerfOS_Processor
__SUPERCLASS :
__DYNASTY :
__RELPATH :
__PROPERTY_COUNT : 1
__DERIVATION : {}
__SERVER :
__NAMESPACE :
__PATH :
InterruptsPersec : 112

PS C:\>
Create a Custom Plugin
If you haven't already created the code for your plugin, you can simply use Notepad/WordPad and enter your code.
Example
Below is an example that will graph the 'InterruptsPersec' metric. The 'gauge' graph type will be labeled as 'mycustom-plugin' in the Dashboard. For best results, it's recommended that you use either the 'gauge' or 'counter' graph type for defining any custom plug-in.
# true:: Always return true
def run
    items = execute_wmi_query("Select InterruptsPersec from Win32_PerfFormattedData_PerfOS_Processor where Name='_Total'")
    for item in items do
        value=item.InterruptsPersec
    if is_number?(value)
        @logger.debug("Total InterruptsPersec: #{value}")
        gauge('mycustom', 'plugin', 'gauge', 'cpuinterruptsgraph', value)
    else
        @logger.debug("The returned InterruptsPersec(#{value}) is not a number")
    end
    end
end
Where,
- gauge - graph type
- mycustom-plugin - the name of the plugin
- cpuinterruptsgraph - the name of the graph
- value - the value that will be graphed
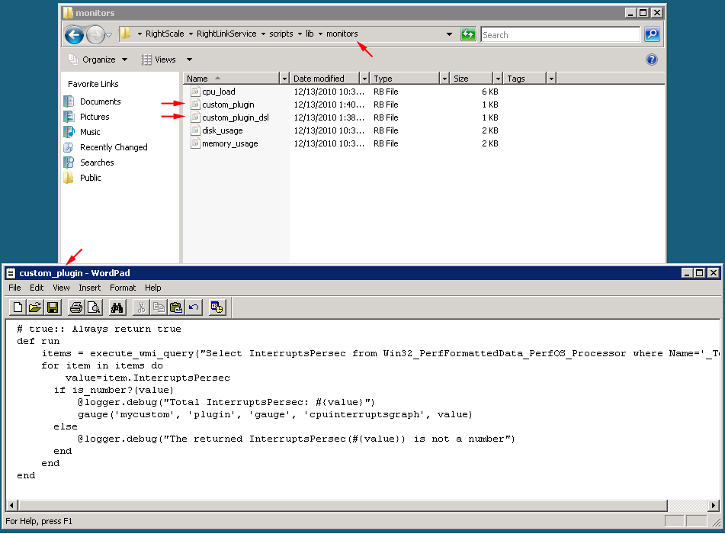
Place the Custom Plugin in the Correct Directory
Be sure to save your plugin as a .rb file (e.g., custom_plugin.rb) into the appropriate directory on the Windows server:
Warning! The actual installation path may be different depending on the version of Windows. Tip: Search for the RightScale
folder
- For Windows i386 - C:\Program Files\RightScale\RightLinkService\scripts\lib\monitors
- For Windows x64 - C:\Program Files (x86)\RightScale\RightLinkService\scripts\lib\monitors
Plugins must be placed in the appropriate directory on the instance otherwise RightLink will not be able to properly discover it. In the same directory you will also find plugins for the monitors that are currently supported by default (cpu, disk, memory, etc.).
Test and Verify
Once the plugin file has been added in the appropriate directory, go back to the Dashboard and click on (or refresh) the Server's Monitoring tab. In a few minutes you should see the new graph(s) being displayed. (You do not have to reboot the instance or stop/restart the RightLink service.)
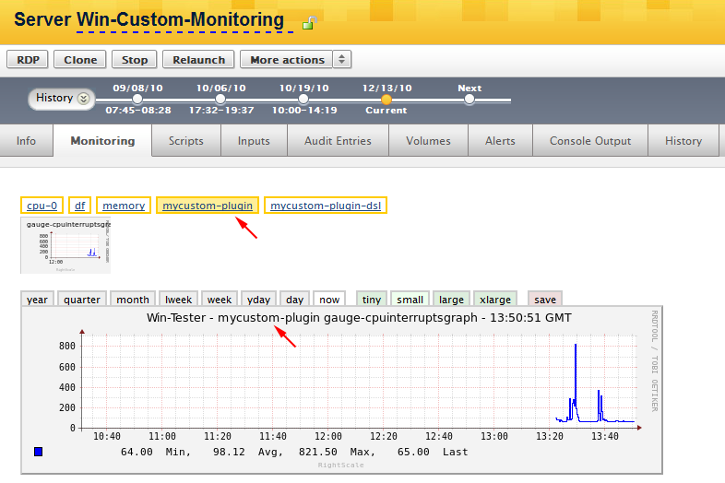
Congratulations! You just created a custom plugin and manually added it to a running Server, as well as verified that the data is properly being graphed in the Dashboard.
Troubleshooting
If the graph is not generated, follow these steps to troubleshoot your monitoring plugin.
By default, the logging level for the monitoring service is set to 'Logger::INFO' in the core monitoring script:
- For Windows i386 - C:\Program Files\RightScale\RightLinkService\scripts\monitoring.rb
- For Windows x64 - C:\Program Files (x86)\RightScale\RightLinkService\scripts\monitoring.rb
To increase the log verbosity, edit the monitoring.rb file and replace
@logger.level = Logger::INFO
with
@logger.level = Logger::DEBUG
The monitoring service will have to be restarted by deleting the 'monitoring.pid' file located in:
C:\Windows\Temp\RightScale\
or on older RightLink based images:
C:\Users\RightScale\AppData\Local\Temp\RightScale\
PS C:\Windows\Temp\RightScale> dir

Directory: C:\Windows\Temp\RightScale

Mode LastWriteTime Length Name
---- ------------- ------ ----
-a--- 12/13/2010 12:41 PM 528609 monitoring.log
-a--- 12/13/2010 12:06 PM 4 monitoring.pid

PS C:\Windows\Temp\RightScale> Remove-Item monitoring.pid
PS C:\Windows\Temp\RightScale> notepad monitoring.log
The 'monitoring.log' and 'monitoring_errors.log' files located in the same directory will contain the logging data.
Troubleshooting File Encoding
If you see the following error message in the 'monitoring_errors.log' file, it's possible that the monitor file is not using the ASCII encoding.
Monitoring plugin failed to start:
SyntaxError: (eval):2:in `initialize_monitors': compile error
(eval):1: Invalid char `\377' in expression
(eval):1: Invalid char `\376' in expression
By default, PowerShell creates files with 'Little Endian' encoding. Use this PowerShell command to make sure the file is created as ASCII:
echo "# true:: Always return true" | Out-File -Encoding ASCII custom_plugin.rb
DSL Equivalent
The DSL equivalent for the previous 'InterruptsPersec' Ruby example looks like the following:
wmi_query "Select InterruptsPersec from Win32_PerfFormattedData_PerfOS_Processor where Name='_Total'"
wmi_query_send_attributes 'InterruptsPersec'
collectd_plugin 'mycustom-plugin-dsl'
collectd_type 'gauge'
collectd_type_instance 'cpuinterruptsgraph'
collectd_sender :gauge
For more details on writing DSL-based plugins, please see Add a Custom Monitoring Plugin Automatically with RightScripts or Chef Recipes.
Changing Default Namespace
By default the wmi query will use the 'root/cimv2' name space. Here are two example monitors that use the 'root/hardware' name space to query 'EnabledState':
Ruby version:
# true:: Always return true
def run
  require 'win32ole'
  wmi = WIN32OLE.connect("winmgmts://./root/hardware")
  items = wmi.ExecQuery("select EnabledState from AdminDomain where Name='Management Access Point (MAP) Addressing Root'")
  for item in items do
    value=item.EnabledState
    if is_number?(value)
      @logger.debug("AdminDomain EnabledState: #{value}")
      gauge('custom-namespace', 'plugin', 'gauge', 'enabledstate', value)
    else
      @logger.debug("AdminDomain EnabledState(#{value}) is not a number")
    end
  end
end
DSL Equivalent:
def init
  @wmi = WIN32OLE.connect('winmgmts:root\hardware')
end

wmi_query                 "select EnabledState from AdminDomain where Name='Management Access Point (MAP) Addressing Root'"
wmi_query_send_attributes 'EnabledState'
collectd_plugin           'dsl-custom-namespace'
collectd_type             'gauge'
collectd_type_instance    'EnabledState'
collectd_sender           :gauge