Overview
In addition to using the standard set of RightScale monitoring metrics, you can set up monitoring for your own (user-defined) processes. You can accomplish this using either imported RightScale ServerTemplates (easiest) or custom ServerTemplates.
Setting up Monitoring using a RightScale ServerTemplate
Monitoring your user-defined processes by importing a RightScale ServerTemplate and configuring the correct inputs is the recommended method. You can also use a custom ServerTemplate but it is a more complex process and should only be used if you cannot use an imported RightScale ServerTemplate for whatever reason.
Steps
- Import any officially supported Rightscale server template from the Multicloud Marketplace by going to the MultiCloud Marketplace (Design > MultiCloud Marketplace > ServerTemplates) and importing the most recently published revision of the desired ServerTemplate into your RightScale account.
- After importing the ServerTemplate, create your server (click Add Server).
- Go to your server's Inputs tab (your server > Inputs ) and click Edit.
- Enter a text value for either the 'Process List' or 'Process Match List' input for the process that you want to monitor.
- The Process List input is a space-separated list of processes that you want to monitor in the RightScale Dashboard (for example, sshd crond).
- The Process Match List input is a space-separated list of pairs used to match the names of additional processes to monitor in the RightScale Dashboard. Paired arguments are passed in using the following syntax: '
/ ' (for example, ssh/ssh* cron/cron*).
Note: Theportion of this input refers to the monitoring graph's name, and the portion should be the regular expression used to match the process name(s). For example, if the value 'secure_shell/ssh*' is used instead, then the collectd monitoring graph would be named 'processes-secure_shell' accordingly.
- Click Save. Monitoring of these processes is now enabled on your server when it is launched.
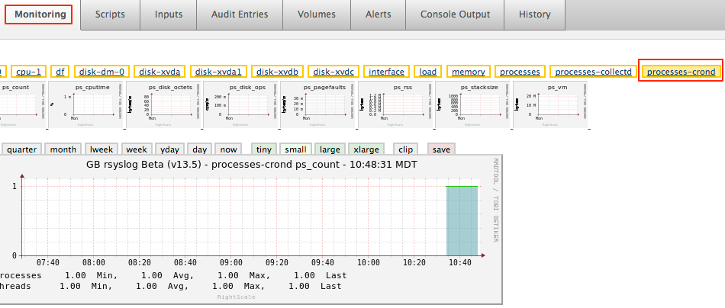
- After launching your server, go to the Monitoring tab (your server > Monitoring ) and select processes-
to display the process monitoring charts and view the monitoring data.
Setting up Monitoring using a Custom ServerTemplate
Although using an imported RightScale ServerTemplate for setting up your process monitoring is recommended, you can also use a custom ServerTemplate for this purpose, if your situation requires it. The following two sections provide instructions for setting up monitoring for both Chef-based and RightScript based custom ServerTemplates.
Setting up monitoring for a Chef-based Custom ServerTemplate
- Determine what version of RightLink (preinstalled on every RightImage) or the version of the image that your custom ServerTemplate or MultiCloud image is using by opening the ServerTemplate and clicking on the Images tab.
- Add the necessary Chef cookbook(s) to your custom ServerTemplate based on the Rightlink/image version your custom template is using:
a. Import the ' Base ServerTemplate for Linux' ServerTemplate that includes the same image and/or Rightlink version that your custom ServerTemplate is using. The ServerTemplate must use the same MultiCloud image and/or Rightlink version as your custom ServerTemplate for compatibility reasons.- For example, if your custom ServerTemplate is using the most recent version of 'RightImage_CentOS_6.4_x64_v13.5, import the 13.5 version of the 'Base ServerTemplate for Linux' ServerTemplate, which includes this particular version of the image.
- You can always verify and compare exactly which RightLink version and/or image is used by importing a ServerTemplate and then navigating to the template's Images tab
b. Once imported, navigate to the your ServerTemplate > Scripts tab.
c. Click the Modify action button, then click the Attach Cookbooks action button.
d. Within the 'Attach Cookbooks' popup box, select theRightscale
cookbook from the 'Cookbooks' column.
e. The available cookbook versions will show in the right side pane of the popup. Ensure that the appropriate version matching your image/Rightlink version is selected, then click Attach Selected.
f. If there are any Dependent Cookbooks listed on the Scripts tab (right pane), ensure that they are also attached to the ServerTemplate. This can be done by using the small magnifying glass icon to the right of the dependent cookbook, which will search for a matching cookbook with that name.
- Add the necessary monitoring recipe to your custom ServerTemplate:
a. On the Scripts tab of your ServerTemplate, click the arrow icon next to theRightscale
cookbook to expand the list of available recipes within this cookbook
b. Locate the rightscale::default recipe and click and drag the recipe over to theBoot Sequence
section of the scripts tab. Recipe or script additions are saved immediately, so you can now move on to configuring the monitoring inputs in the next section. - Proceed by creating a new Server from your ServerTemplate.
Configure User Defined Process Monitoring Inputs
- Once you have created a server from your custom ServerTemplate, navigate to the your Server > Inputs tab.
- Click Edit and enter a text value for either the 'Process List' or 'Process Match List' input for the process that you want to monitor.
- The Process List input is a space-separated list of processes that you want to monitor in the RightScale Dashboard (for example, sshd crond).
- The Process Match List input is a space-separated list of pairs used to match the names of additional processes to monitor in the RightScale Dashboard. Paired arguments are passed in using the following syntax '
/ ' (for example, ssh/ssh* cron/cron*).
Note: Theportion of this input refers to the monitoring graph's name, and the portion should be the regular expression used to match the process name(s). For example, if the value 'secure_shell/ssh*' is used instead, then the collectd monitoring graph would be named 'processes-secure_shell' accordingly.
- Click Save. Monitoring your own user defined processes is now enabled on your server when it is launched.
- After launching your server, go to the Monitoring tab (your server > Monitoring ) and select processes-
to display the process monitoring charts and view the monitoring data.
Setting up Monitoring for a RightScript-based Custom ServerTemplate
- Determine what version of RightLink (RightLink is preinstalled on every RightImage) or the version of the image that your custom ServerTemplate or MultiCloud image is using by opening the ServerTemplate and clicking on the Images tab.
- Go to the MultiCloud Marketplace ( Design > MultiCloud Marketplace > RightScripts ) and determine which version of the 'SYS Monitoring Install' RightScript is the correct one to use with your version of RightLink.
- For example, if your custom ServerTemplate is using the image 'RightImage_CentOS_5.4_x64_v5.6 - 11H1', then you will want to import the 11H1 version 'SYS Monitoring Install' Rightscript.
- You can always verify and compare exactly which RightLink version and/or image is used by importing a ServerTemplate and then navigating to the template's Images tab
- See the following links for the latest corresponding RightScript versions:
- 13.x (Infinity, v13.x and v5.8 RightLink images)
- 12.11.x (LTS, v12.11-LTS and some v5.8 RightLink images)
- 11H1 (v5.0-v5.6 RightLink images)
- v8 (for v4.x non-RightLink images
- Click Import to import the desired version of the 'SYS Monitoring Install' RightScript.
- Configure monitoring for your ServerTemplate using the 'SYS Monitoring Install' RightScript:
- Go to your ServerTemplate > Scripts and click Modify.
- In the right side pane, locate the 'SYS Monitoring Install' RightScript imported in the previous step.
- Click and drag on the 'SYS Monitoring Install' RightScript and drag it to the 'Boot Sequence' section
- Proceed by creating a new Server from your ServerTemplate.
Configure User Defined Process Monitoring Inputs
- Once you have created a server from your custom ServerTemplate, navigate to the your Server > Inputs tab.
- Click Edit and enter a text value for either the 'MON_PROCESSES' or 'MON_PROCESSMATCH' input for the process that you want to monitor.
- The MON_PROCESSES input is a space-separated list of processes that you want to monitor in the RightScale Dashboard (for example, sshd crond).
- The MON_PROCESSMATCH input is a space-separated list of pairs used to match the names of additional processes to monitor in the RightScale Dashboard. Paired arguments are passed in using the following syntax 'name/regex' (for example, ssh/ssh* cron/cron*).
Note: Theportion of this input refers to the monitoring graph's name, and the portion should be the regular expression used to match the process name(s). For example, if the value 'secure_shell/ssh*' is used instead, then the collectd monitoring graph would be named 'processes-secure_shell' accordingly.
- Click Save. Monitoring custom defined processes is now enabled on your server when it is launched.
- After launching your server, go to the Monitoring tab (your server > Monitoring ) and select processes to display the process monitoring charts and view the monitoring data.
Configure an Optional Alert
If you wish to configure an optional alert for your user defined process, then view the Create a Custom Alert Specification tutorial. The monitoring system tracks multiple metrics with regards to the monitored process, but most importantly you can monitor the number of processes running for the given process. The syntax for the custom alert specification to count the number of processes would be as such:
- processes-< your process >/ps_count.processes
Important! If you used the MON_PROCESSMATCH input (RightScript) or the 'Process Match List' input (Chef), then <your process> should be the value of the **secure_shell** /ssh\*
for the MON_PROCESSMATCH or Process Match List input, then my alert would look like this:
- processes- secure_shell /ps_count.processes