Objective
To create a custom Alert specification. When you create a new Alert, several of the most common Alert specifications have already been predefined for your convenience. However, you may want to create your own custom Alert specification. This tutorial addresses this possibility.
Overview
You can only create an alert specification for a variable that's being monitored (has a graph on the Dashboard Monitoring tab of your Deployment). The predefined list of metrics is based upon the monitoring graphs that are configured by default in all ServerTemplates published by RightScale via the appropriate monitoring setup script. (e.g. rightscale::setup_monitoring, SYS Monitoring install Windows, etc.)
However, there may be additional monitored metrics that are being monitored on your servers that are not listed in the dropdown menu. In such cases, you can follow the instructions below to create a custom alert specification.

Steps
Locate a Server to Monitor
The first step is to find a graph that you want to monitor. Go to the Monitoring tab of your deployment or server. Find a graph (of a server) for which you would like to create an alert specification.

Create the New Custom Entry Alert Specification
Next, in a new browser window/tab, go to the Server's Alerts tab. Click New. In this example we are setting up alerts for monitoring the number of currently queued haproxy requests on the PHP FE1
server. Instead of using one of the predefined alerts, selectthe --custom entry-- option.

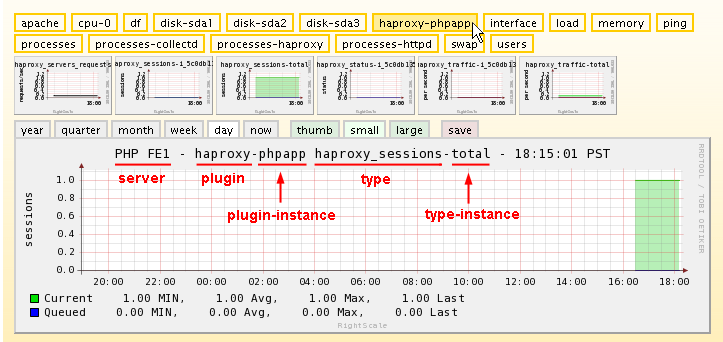
To define a custom metric for collectd to monitor, you need to override the list of predefined metrics by defining one using the following format:
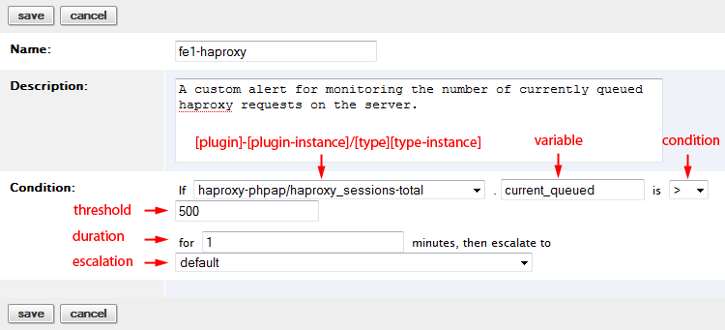
[plugin]-[plugin-instance]/[type]-[type-instance] - (Refer to the screenshot of the preceding graph to see where to find this information.)
Example: haproxy-phpapp/haproxy_sessions-total
WARNING! For the current example, each user may have a different 'File' name. Under the Inputs tab, the value for LB_APPLISTENER_NAME defines the name of the plugin-instance. LB_APPLISTENER_NAME= text:phpapp. If you change this value, you must also change the filename for the alert specification, otherwise the alert specification will not work.

Provide specific info for your custom Alert
Next, you will need to provide basic information about the custom alert.
- Name - A short nickname of the alert specification.
- Description - A more detailed description of the alert's purpose and how to use it.
- Variable - Open an SSH console into the instance and run the following command to list all variables and their valid ranges.
less /usr/share/collectd/types.db
Example: haproxy_sessions current_queued:GAUGE:0:65535, current_session:GAUGE:0:65535
Note: Again, the type is 'haproxy_sessions' and the associated variables are 'current_queued' and 'current_session'. If range is 'u', it is unknown. Users can only enter one variable for each alert specification.
- Condition Threshold - The condition and threshold that the monitored variable must meet in order for an alert to be triggered. For example, if you are monitoring
haproxy-phpapp
and you set the condition and threshold to> 500,
an alert is triggered if the number of currently queued haproxy rerquests is above 500. - Duration - The duration (in minutes) for which the condition must be true without interruption in order for an alert to be triggered. RightScale evaluates each alert specification once a minute. For example, it may be a good practice to require the cpu idle to be below 20% for 5 minutes in a row before actually triggering the alert.
- Escalation - The name of the alert escalation that will be executed if the alert conditions are met. The escalation list must be defined on the deployment of a server or on the account. A
default
list is used if no matching list is found.
Click Save.
Once you've created the custom alert for this particular server, you can now use the import alert
button to add the same alert to different Servers or ServerTemplates.