Objective
To add QuickMonitoring Graphs to a RightScale account.
Prerequisites
- Requires 'observer' user role privileges to configure this feature.
- Running server enabled for monitoring. Note: All ServerTemplates published by 'RightScale' include built-in monitoring support.
Overview
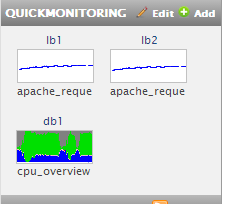
Are there specific graphs that you would always like to see when you're logged into the Dashboard? If so, you can use QuickMonitoring graphs to add up to 8 of the most important graphs in a RightScale account to the left-hand panel of the Dashboard. Graphs are updated every minute and are account and user-specific so you can create different thumbnail-sized graphs for each of your accounts. Click on a thumbnail to view a larger version of the graph. Rename graphs and rearrange the order, as necessary.
For example, if you're using HAProxy load balancer servers to distribute traffic across your application tier, you may want to see the graph that shows the number of incoming 'apache/apache_requests' requests or maybe you want to always see the 'cpu-0/cpu-idle' graph for your master database server.
Each graph represents a specific metric for a particular server. (i.e. You cannot create a QuickMonitoring graph of a Cluster Monitoring graph.)
Steps
- In the left-hand pane of the Dashboard, click Add in the QuickMonitoring section.
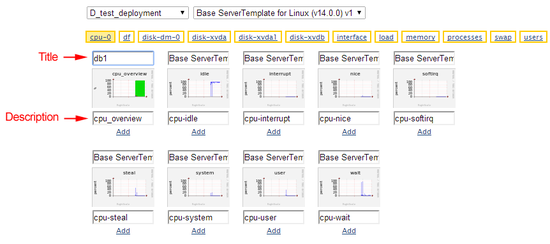
- Select the deployment and specific server within that deployment for which you want to create a QuickMonitoring graph. You will only be able to select operational servers that are enabled for monitoring. If you are using a custom ServerTemplate, you may need to add an additional script to the ServerTemplate's boot script list and relaunch the server if you do not see any graphs under its Monitoring tab. See Setting up collectd.
- Select the server's specific graph/metric for the QuickMonitoring graph. Rename the title of the graph, as necessary. Title names are automatically truncated after the 13th character. (Note: You will not be able to change a graph's title or description once the QuickMonitoring graph is created. In order to make those types of changes you will need to create a new QuickMonitoring graph.)
- View and test results. You can click on a thumbnail to view the enlarged version of that graph under the server's Monitoring tab.