Set Up Monitoring
How do I set up a server for real-time monitoring?
Any ServerTemplate published by RightScale is automatically pre-configured to support real-time graphical monitoring where you can view RRDtool graphs inside the RightScale Dashboard for a variety of server-level metrics. For a list of all the metrics that are monitored by default, see Monitored Metrics. If you are using a custom ServerTemplate that you either cloned or created yourself, you should make sure that it's properly configured to support RightScale's monitoring features, which is why it's strongly recommended that you use one of RightScale's Base
ServerTemplates to start any custom ServerTemplate development from scratch. See the ServerTemplate Developer Guide to learn how to Create Custom ServerTemplates.
You can also extend RightScale's default set of monitored metrics by adding additional collectd plug-ins. See Custom collectd plug-ins.
Important! RightScale's Alert system is built on a server's monitored metrics. If you do not see graphs under a Server's Monitoring tab in the RightScale Dashboard, you will not be able to set up any automated alerts for the server. Conversely, if the server is properly configured for graphical monitoring and you do see real-time graphs, you can create alert specifications that trigger an escalation routine which may consist of one or more automated actions such as sending an email, running a script, rebooting the server, etc. And since RightScale's auto-scaling feature is built upon the Alert system, you will not be able to set up an alert-based scalable server array unless monitoring is properly configured on your running servers.

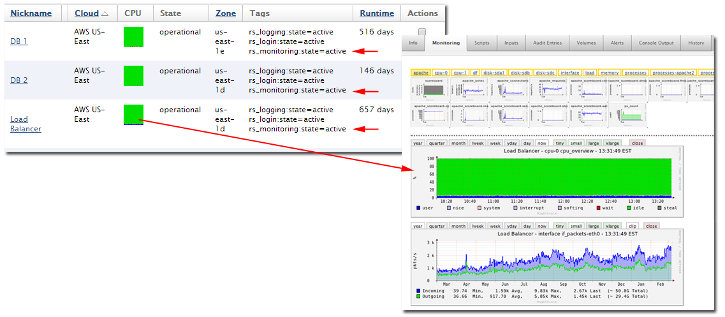
In the example screenshot above, notice that each server has the ' rs_monitoring:state=active' tag, which means it's properly configured for RightScale monitoring support. From the a deployment's Servers tab you can click on the CPU thumbnail graph to quickly jump to the server's Monitoring tab where you can see all of its related real-time monitoring graphs.
How do I set up monitoring dashboards?
You can save the metrics that you want to see on your dashboard. Simply click the metric you want to see and then select the save
tab at the upper right of the chart.
That metric will now move below the dotted line and will be visible each time you bring up the monitoring dashboard. Drag and drop to reorder any of the saved charts that are below the dotted line.
How should I use widgets?
RightScale Widgets (Design > Widgets) are useful for creating a custom view inside the RightScale Dashboard that gives you a high-level overview of all the most relevant metrics related to your account. Widgets are user and account-specific so you can create a unique panel of widgets for each of your accounts that only you will see when you log in to the Dashboard. By default, each account has access to a library of built-in
and custom
widgets that you can add to your Widgets panel (Dashboard > Overview tab) as-is or customize them for your own purposes. You can also create your own custom Widgets from scratch using Liquid Markup language.
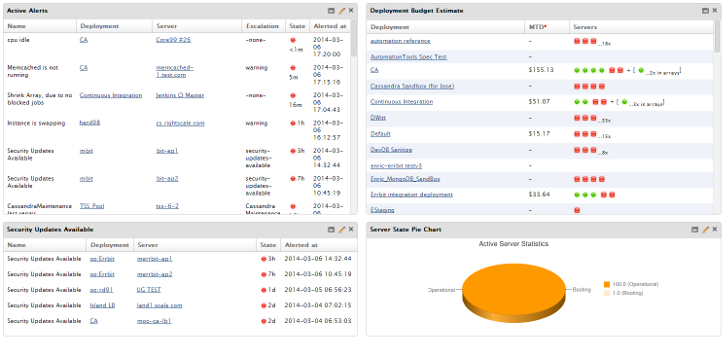
For example, many system administrators find it useful to create widgets that help them monitor all critical alerts across their account so that when you log in to the Dashboard the first thing you'll see are all the critical issues that should be addressed immediately or prioritized accordingly. The default widgets are highlighted with and * below.
Custom
- Active Alerts - View all triggered alerts that are currently active ('red' status ball) on your account.
- Deployment - View information about deployments for your account.
- Deployments Bar Charts - View the states of servers in deployments as bar charts.
- Security Updates Available - Identifies servers with Linux security updates available.
- Server State Pie Chart - View the states of all servers on your account as a pie chart.
- Servers - View information about servers for your account.
Built-in
- Cloud Credential Status* - View the status of credentials for clouds that are enabled on your account.
- Cluster Monitor - View a Heat Map or Stacked Graph for a Deployment Cluster Monitor.
- Launch a Server in your Cloud* - Launch a server by using one of the several ServerTemplates published by RightScale.
- Review Docs And Tutorials* - Contains links to videos, documentation, and tutorials for new RightScale users.
How does RightScale use Widgets?
Yes, the rumors are true! RightScale runs on RightScale! Our own operations team uses the RightScale Dashboard and API on a daily basis to manage all of the services responsible for supporting the RightScale cloud management platform for all of our users. You may find it quite insightful to learn how we use our own tool internally. For example, here is a screenshot of all the widgets leveraged by one of our staging accounts. When our Operations team logs in to the Dashboard, the first screen they check is the Widgets screen to get a high-level overview about all the critical issues (i.e. active alerts) affecting the servers and deployments within the account so that they can prioritize the issues accordingly.

How should I use Quick Monitoring Graphs?
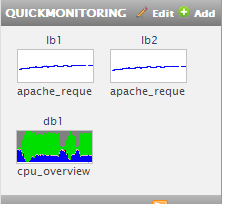
Quick monitoring graphs are useful for giving you a quick, real-time overview of the most critical graphs across your account. For example, if you're using HAProxy load balancer servers to distribute traffic across your application tier, you may want to see the graph that shows the number of incoming 'apache/apache_requests' requests or maybe you want to always see the 'cpu-0/cpu-idle' graph for your master database server.

Use QuickMonitoring to save up to 8 of the most commonly viewed graphs. Graphs are updated every minute and are account and user-specific so you can create different graph thumbnails for each of your accounts. Click on a thumbnail to view a larger version of the graph. Rename graphs and rearrange the order, as desired.
See Add QuickMonitoring Graphs
Set Up Alerts
Who should receive alert notifications?
Account-specific Alert Notifications
Each RightScale account is pre-configured with three Alert Escalations (default, critical, and warning) that are commonly used by the core set of pre-configured alerts that are used in most ServerTemplates published by RightScale. The user who initially created the RightScale account (a.k.a. the owner
of the RightScale account) will receive email notifications related to the account's pre-configured alert escalations (default, critical, and warning). It's recommended that you consider changing the email (user) that was initially associated with these alert escalations to a person/group (e.g. ops@example.com) that's more appropriate for handling escalations related to your account.
- Go to Design > Alert Escalations. At a minimum you should see the three, default pre-configured escalations. Notice that these alerts are configured to send emails to the 'owner' of the account.

- Update the actions within each escalation, as necessary. Typically, most users prefer to update the default escalations to send emails (for triggered alerts) to an email alias instead of to an individual user. For example, perhaps you have an email alias for the operations team ( ops@example.com) who manages all triggered alert conditions.
Deployment-specific Alert Notifications
Additionally, you may want to consider creating deployment-specific alert escalations, which would allow you to leverage the same alert escalations (e.g. critical, warning, etc.) across all of your ServerTemplates, while also giving you the flexibility to create a unique set of actions that's specific to a particular deployment.
See Override Alert Escalations.
How can I track and forecast cloud infrastructure costs?
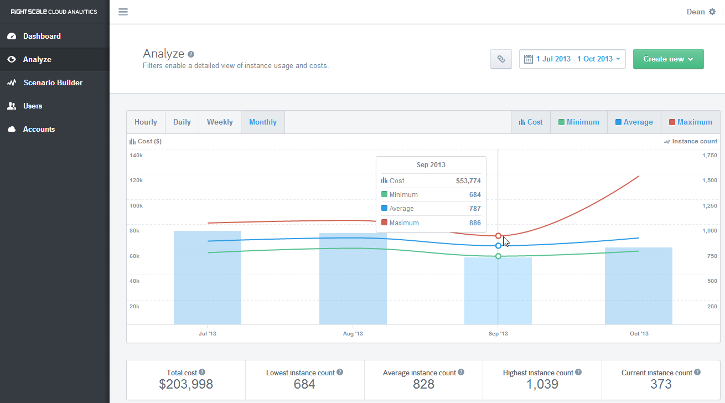
The best way to manage your actual and projected cloud infrastructure costs is to use RightScale Optima. Read the Introducing Optima: A Better Way to Manage Cloud Costs blog post to learn how you can use this powerful tool to get a more accurate breakdown of cloud costs across your entire account because at the end of the day, both you and your CFO will sleep better at night knowing where your money is actually being spent in the cloud.

Set up Logging
Where can I view a server's log files?
Log files are saved locally on a running server. You can view the logs by opening an SSH session and running the following commands.
Note: You will need to switch to the 'root' user in order to view the log messages. Only users with 'server_login' and 'server_superuser' user role privileges will be allowed to view the logs.
sudo -i
view /var/log/messages