The features described on this page will soon be deprecated. Refer to the latest documentation for information on the latest features.
Overview
RightScale Optima lets you forecast your future cloud compute costs with Scenario Builder. You can forecast costs for existing workloads or for new workloads. You can also do what-if analyses to determine how costs will change if you purchase Reserved Instances, adjust instance types, or run a workload in a different cloud.
You can also use the forecasts created in Scenario Builder to define your cloud budgets and determine where to set your Budget Alerts. Scenarios are private to you, so other users will not see your forecasts.
Forecasting Costs for a New Workload
If you want to forecast costs for a brand new workload, or one that is not currently running in the cloud, you can create a blank scenario and specify the necessary infrastructure.
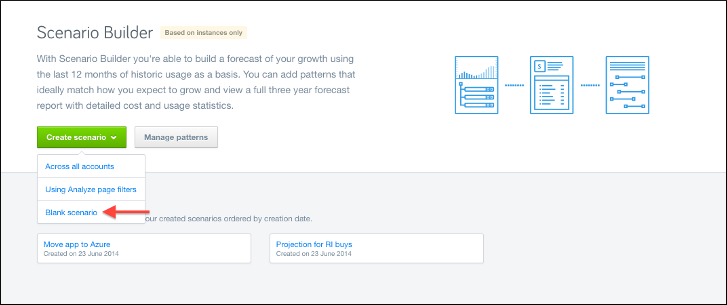
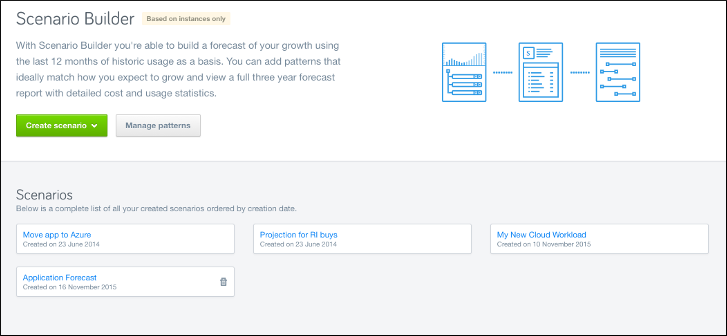
From the navigation bar in Optima select Scenario Builder.
Click Create Scenario and select Blank scenario from the dropdown.
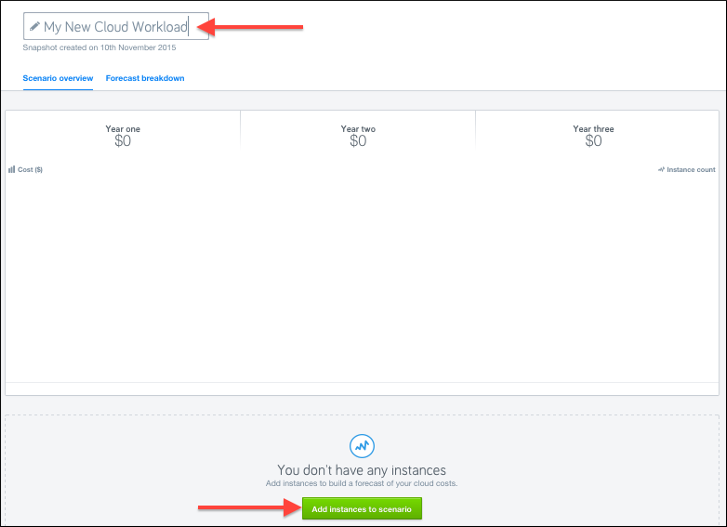
Give your scenario a name and click Add instances to scenario.
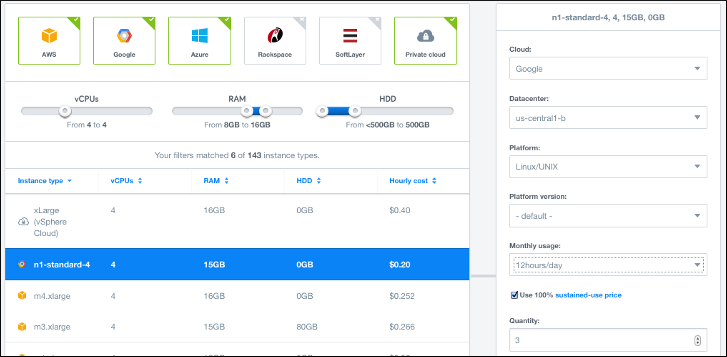
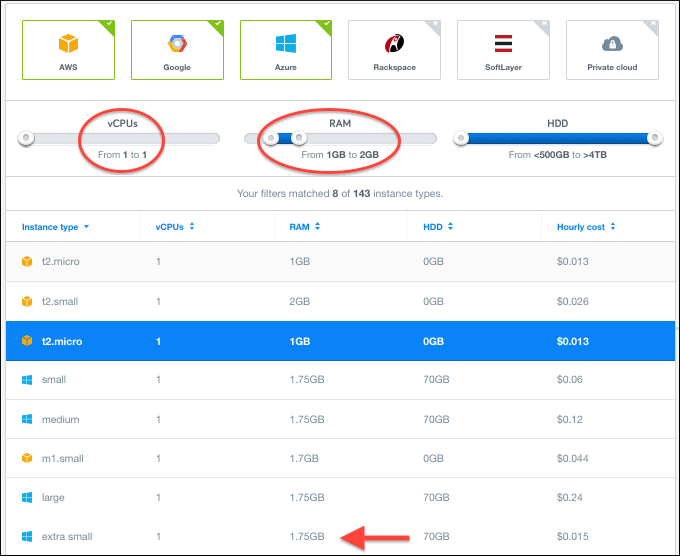
In the Add instances page, select the clouds you want to consider and adjust the sliders for your CPU, memory, and HDD requirements. The list will update to show you instance types that match your requirements along with the hourly price.
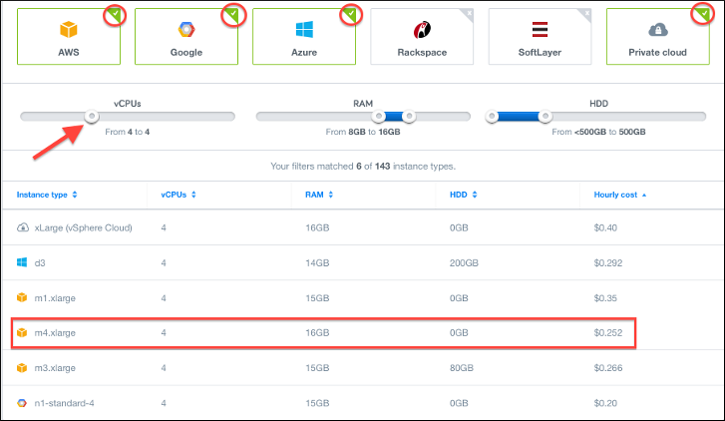
Select an instance type. A panel appears allowing you to specify the region, datacenter, and platform, monthly runtime schedule, and the number of instances.
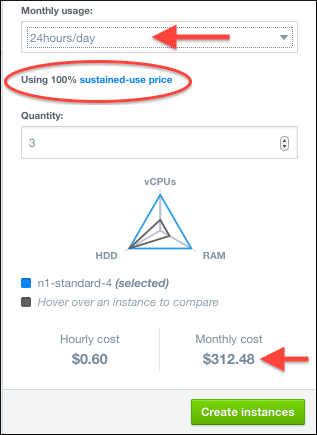
RightScale displays the monthly cost based on your specific criteria, including the Google sustained-use discount if you plan to run a Google instance continuously. Click Create instances to add the specified instance(s) to your scenario.
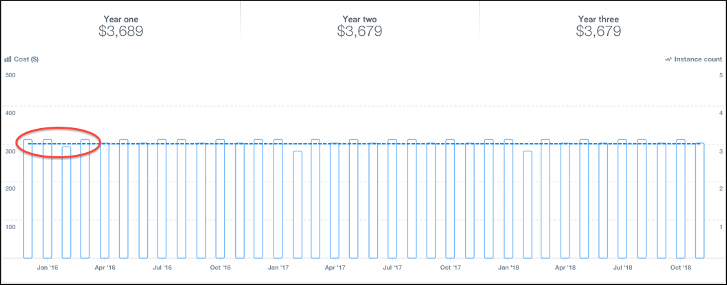
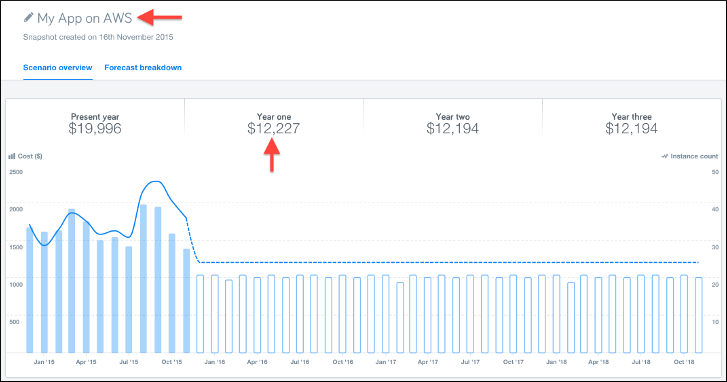
Scenario Builder shows you a 3-year cost projection. Notice that the monthly costs may vary slightly depending on the number of days in a particular month.
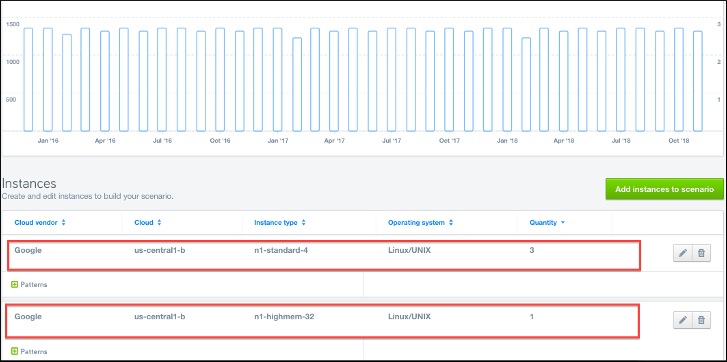
Repeat the process for additional instance types.
Next, if you expect the application load to change over time, you can add patterns to forecast costs of any expected growth (or decline). For example, you might plan for the load on an application to grow steadily or to follow a seasonal pattern. See Adding Growth Patterns to your Forecast. For applications running in AWS, you can also forecast potential savings from purchasing Reserved Instances. See Determining Cost Savings from Purchasing Reserved Instances.
Forecasting Costs for an Existing Workload
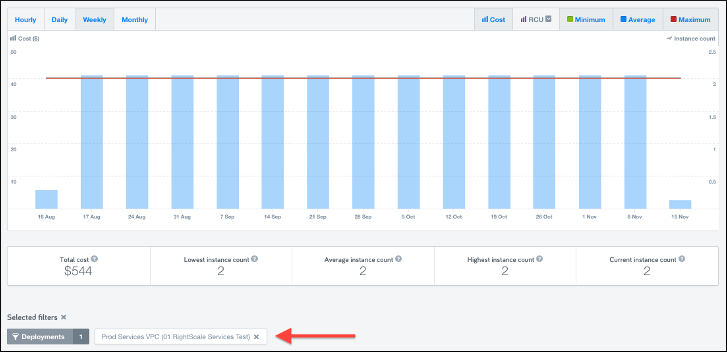
If you want to forecast costs for a workload that is already running in the cloud, you can start by using Instant Analyzer filters to select the particular workload.
From the navigation bar in Optima select Analyze.
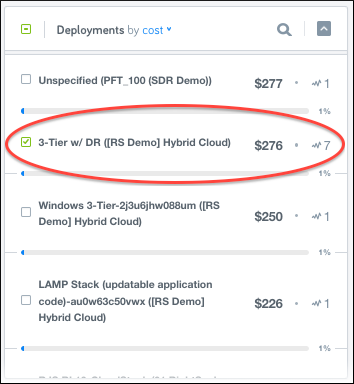
On the Instant Analyzer, use the Deployments filter to drill in on the application for which you want to forecast costs*.*
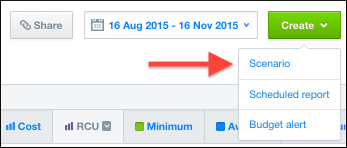
Click Create and select Scenario to create a forecast based on the current filters you’ve selected on the Instant Analyzer.
A new Scenario is created showing costs over the prior 12 months for the selected application. The Scenario also includes a 3-year cost forecast based on the current number of running instances.
Give your scenario a name and, if you want to add more baseline instances that will be included for the entire 3-year forecast, click Add instances to scenario.
If you expect the application load to change over time, you can add patterns to forecast costs of any expected growth (or decline). For example, you might plan for the load on an application to grow steadily or to follow a seasonal pattern. See Adding Growth Patterns to your Forecast. For applications running in AWS, you can also forecast potential savings from purchasing Reserved Instances. See Determining Cost Savings from Purchasing Reserved Instances.
Forecasting Costs for a Group of Workloads
If you want to forecast costs for a group of workloads that are already running in the cloud, you can start by using Instant Analyzer filters to select the group of workloads.
From the navigation bar in Optima select Analyze.
On the Instant Analyzer, use the filters to drill in on the group applications for which you want to forecast costs**. You can select Deployments by name, or use other filters, such as Tags or Cloud to identify a group of workloads.
Click Create and select Scenario to create a forecast based on the current filters you’ve selected on the Instant Analyzer.

A new Scenario is created showing costs over the prior 12 months for the selected filters. The scenario also includes a 3-year cost forecast based on the current number of running instances within that filtered group of workloads.
Give your scenario a name and, if you want to add more baseline instances that will be included for the entire 3-year forecast, click Add instances to scenario.
If you expect the application load to change over time, you can add patterns to forecast costs of any expected growth (or decline). For example, you might plan for the load on an application to grow steadily or to follow a seasonal pattern. See Adding Growth Patterns to your Forecast. For applications running in AWS, you can also forecast potential savings from purchasing Reserved Instances. See Determining Cost Savings from Purchasing Reserved Instances.
Adding Growth Patterns to your Forecast
When forecasting costs, you will need to account for any expected growth or decline in the load on your application. Patterns can be added to your Scenarios in Optima to model these changing needs for infrastructure. Examples include:
a software product that will have a growing number of users over time
a website or e-commerce application that will experience higher traffic during holiday seasons.
a mobile application or game that is may grow exponentially.
a marketing campaign that will see an initial traffic spike followed by a slow decline in traffic over time.
From the navigation bar, select Scenario Builder. Open a saved scenario, or create a new one.
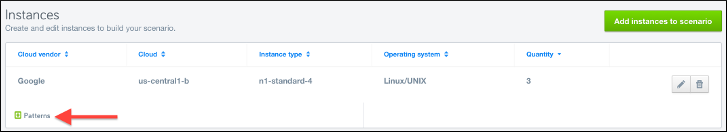
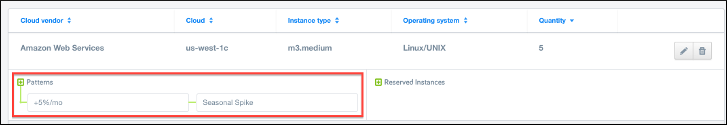
Scroll to the Instances list below the graph and click Patterns for any instance type.
Select an existing Pattern or create a new one.
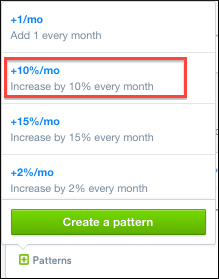
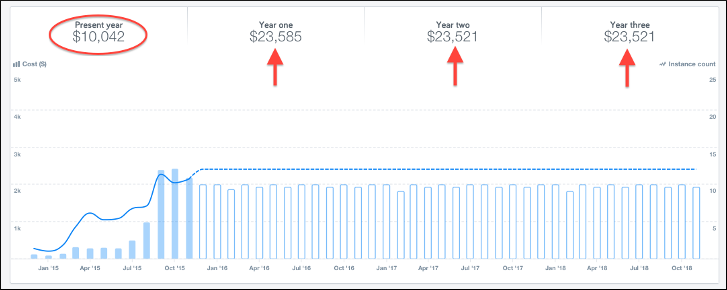
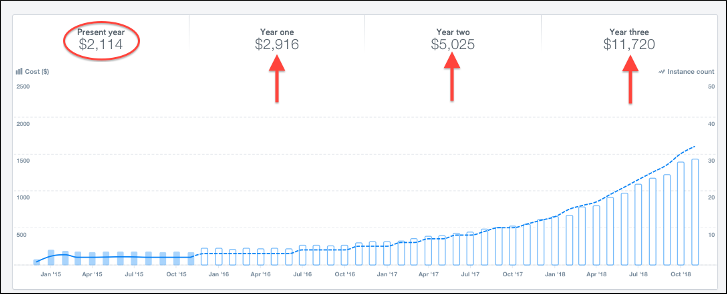
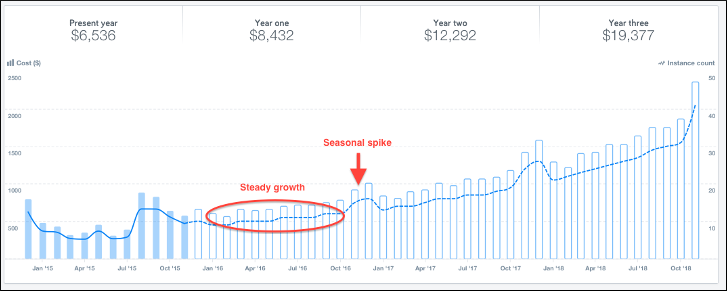
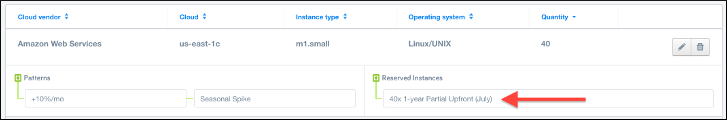
The pattern you select will be applied to the 3-year cost forecast. In the example below there is an increase of 10% each month. You can see the impact of the growth on the future year costs.
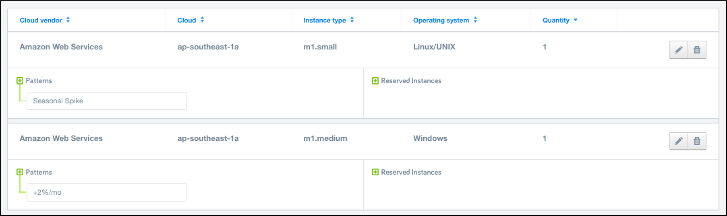
You can add multiple patterns to each instance type. For example, you can apply one pattern with a consistent growth rate of 1% a month and then apply a second pattern with a seasonal spike.
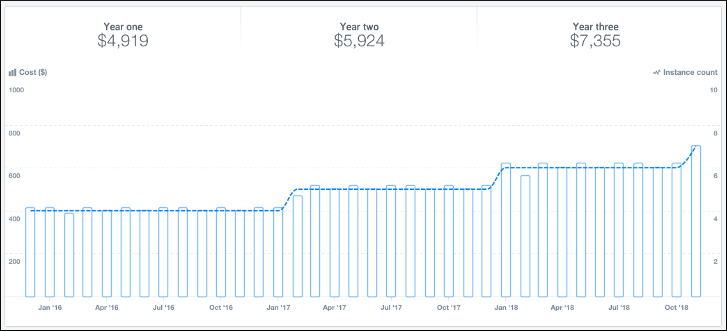
Keep in mind that Optima will calculate the number of instances required by using the baseline instances. In the example below, there is a 2% monthly growth rate. Once an instance is added, the number of instances (and hence the costs) stays flat for several months until the load has grown enough to utilize that most recently added instance. Only then will another instance be added to the cost forecast. As a result, you may see stepped growth patterns as shown below.
Creating New Growth Patterns
You can create and save patterns in Optima and then use those patterns in multiple scenarios.
From Scenario Builder, click Manage Patterns or open any scenario and click Patterns and then click Create new Scenario. Give your pattern a name.
Choose whether to create a temporary pattern (that will apply only during the months and years you select) or a permanent pattern that persists.
Specify the years and months when the pattern applies. You can also create multiple overlapping patterns to model different growth rates during different years. For example, create one pattern with a 5% growth rate that only applies to year 1 and then create a separate pattern with a 1% growth rate for years 2 and 3. Apply both patterns to get a growth rate of 5% for one year and then 2% for the next two years.
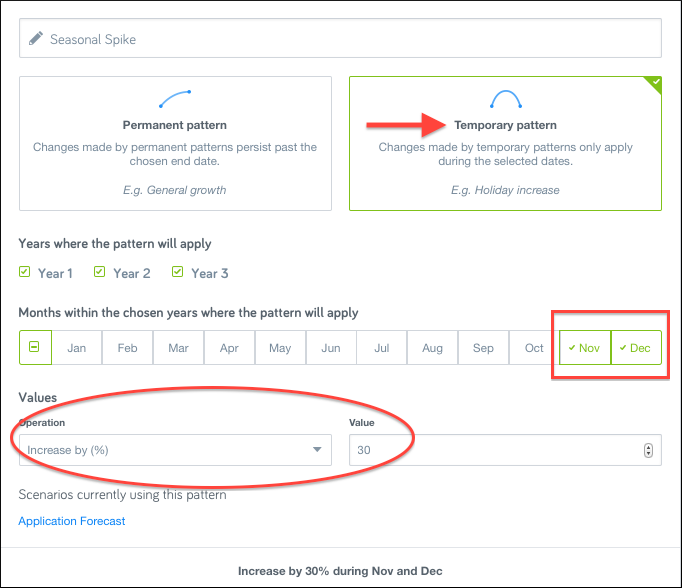
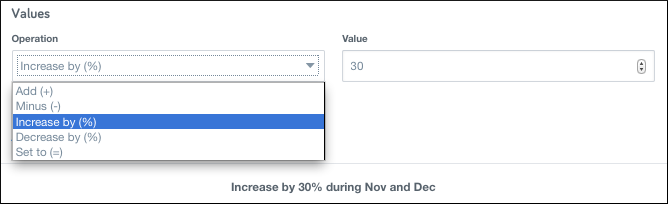
Specify the % or number of instances to increase or decrease each month. You can also set a particular month or set of months to a specific value. For example, you can forecast for a set number of instances to support higher load during a product launch.
Apply patterns to additional instance types as needed. For example, you might apply one pattern to instances running application servers and a different pattern to your database instances.
If you change a pattern, all your scenarios that use that pattern will be updated.
Determining Cost Savings from Purchasing Reserved Instances
For workloads running in AWS, you can often save money by purchasing Reserved Instances. Scenario Builder allows you to forecast the potential savings.
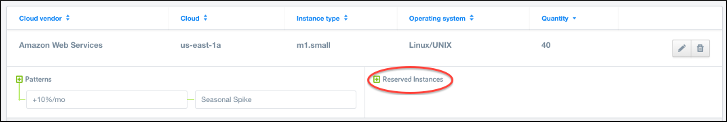
Open any scenario and scroll to the Instances list. Find an instance type in AWS and click Reserved Instances.
Select the type of Reserved Instance to purchase. You’ll see the total % savings for each option as well as the breakeven date assuming that the instances are running continuously (24x7). Click on a purchase option to see the upfront cost.
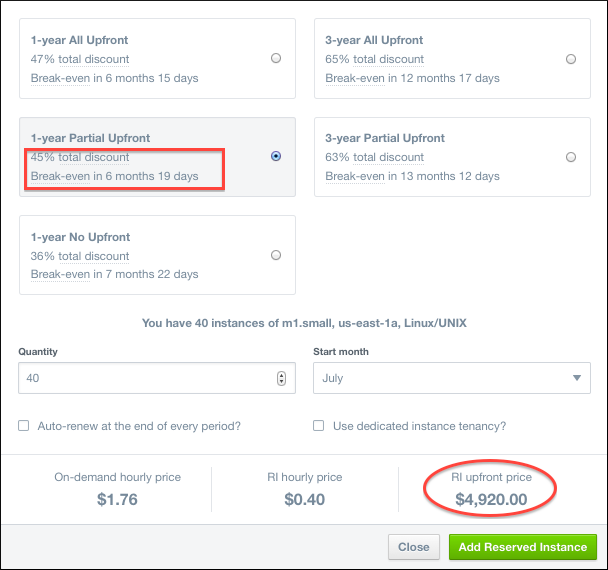
Optima provides a default quantity based on the current number of instances of this type that are running, but you can adjust the quantity.
Click Add Reserved Instance to add the selected RI option to your forecast. Your 3-year forecast costs will now take into account the savings from the Reserved Instances. If you selected 1-year RIs, you’ll see savings just in year 1 of the forecast. If you select 3-year RIs, you’ll see savings for all 3 years.


Determining Costs of Running on a Different Cloud
Many cloud users want to perform what-if analyses to calculate the cost of running a workload on a different cloud.
On the Instant Analyzer, filter by Deployments to select a workload running on a particular cloud.
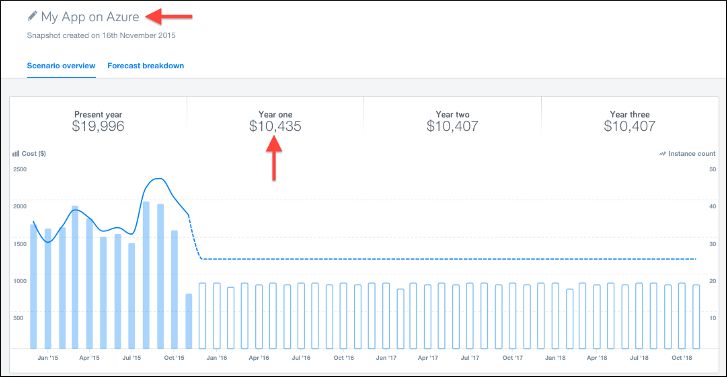
Click Create and select Scenario and give the scenario a name. Make sure to include the current cloud in the name. The scenario will show you the 3-year cost based on the current run rate.
Return to the Instant Analyzer, and with the same filters in place. Click Create and select Scenario and give the scenario a new name that includes the cloud you want to compare.
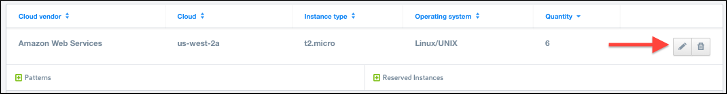
Scroll to the Instances list below the graph. For each instance type, click the Edit (pencil) icon to the right of the Instance type.
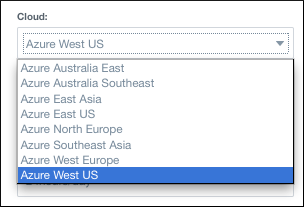
Select the clouds you want to compare. Use the sliders to find similar size instances on other clouds. There may not be instances that exactly match on different clouds, so you will need to choose the closest option.
Select the cloud region for the new cloud and click Save changes.
Repeat for the remaining instances. Add growth patterns to each cloud if needed. For AWS, you can also add Reserved Instances.
Compare the 3-year forecast to see the lowest cost cloud. You can use the same technique to compare different regions on the same cloud.

Reviewing and Sharing Forecast Details
Once you’ve created a scenario, you can review the details of the forecast and share it with others.
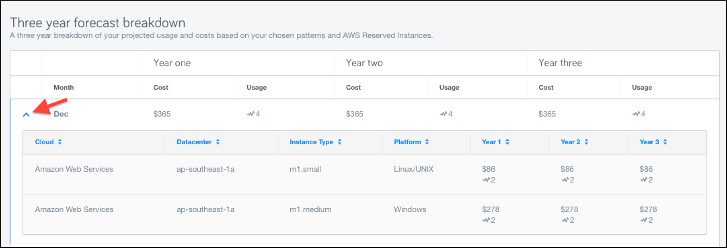
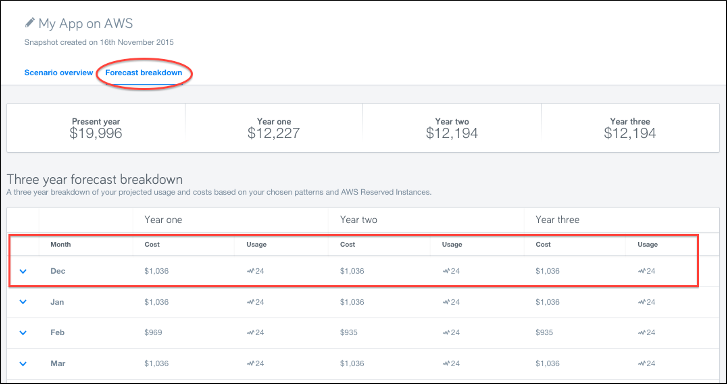
Open any scenario and click the Forecast Details tab. You’ll see month by month details of the number of instances and costs.
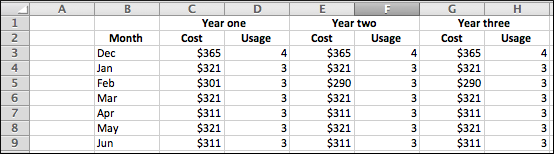
You can copy and paste from the table into a spreadsheet to share the detailed budget with your finance team or managers.
Drill down on individual months to get the breakdown of cloud, datacenter, instance types and platform.