The features described on this page will soon be deprecated. Refer to the latest documentation for information on the latest features.
Overview
The Instance Analyzer in RightScale Optima provides a detailed view of compute costs across all of your public and private clouds as well as virtualized resources.
You can slice and dice and filter your data to gain visibility into spend and usage, which in turn will help you understand the cost drivers of your business.
The Analyze is your central place to understand compute costs and usage. It also serves as a starting point to create scenarios (forecasts), scheduled reports, and budget alerts based on any set of filters you have specified.
Changing the Time Period to Analyze
To get started, set the appropriate date range in the upper right hand corner. You can specify the beginning and end dates, or select from several pre-defined date ranges.
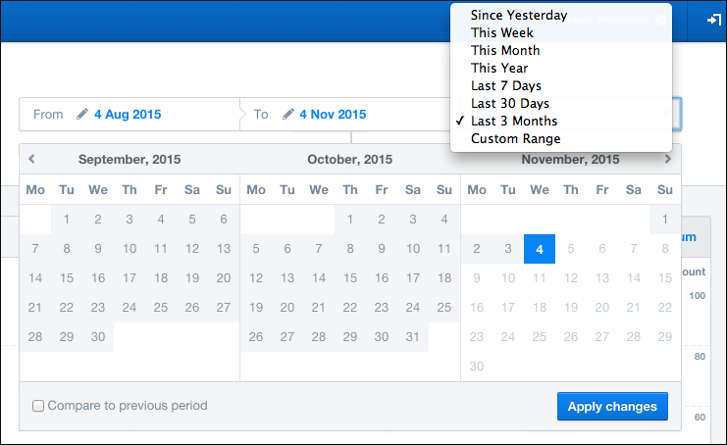
After you have chosen your desired date range, the graph will show you trends based on the time period specified. You can specify the granularity of of data to be hourly, daily, weekly, or monthly using the tabs to the upper left of the graph.
This example shows a weekly view.
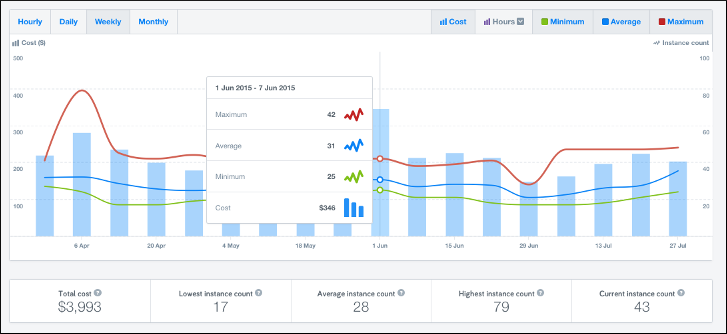
The blue bars represents clouds costs while the lines represent maximum instances (red), average instances (blue), and minimum instances (green) for each time period. You can turn the individual metrics on or off by clicking on their name to the upper right of the graph.
You can add in VM Hours or RightScale Compute Units (RCUs) to your graph (purple bars), which represents RightScale usage. The dark purple bar represents managed RightScale Hours or RCUs. The light purple bar represents unmanaged RightScale Hours / RCUs.
Managing Analyze Filters
Below the graph, you will find various modules that provide ways to slice and dice your data. For the quickest results, start with all of the modules closed and then expand the ones that are most relevant to your analysis.
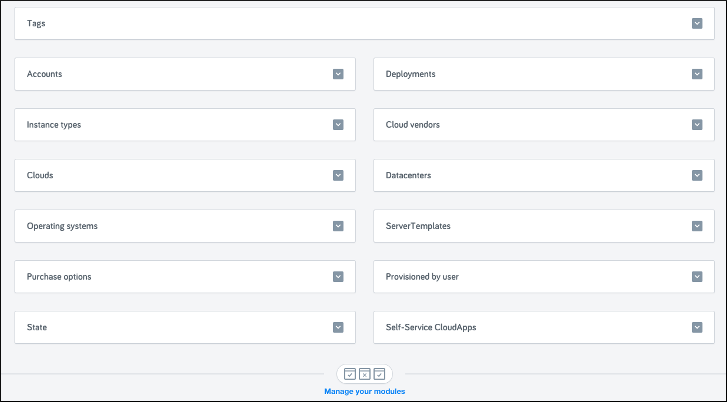
Manage Your Modules
At the bottom of the page you will find an icon, “Manage your modules”, where you can select which modules you would like to see and use within the Instance Analyzer.
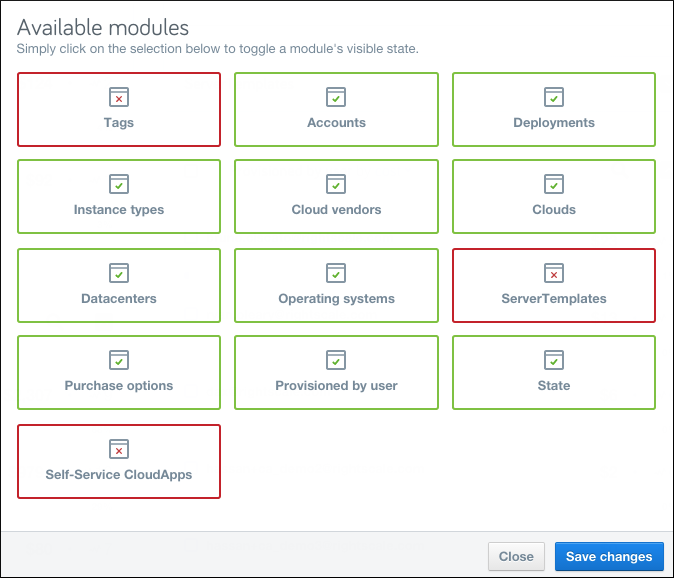
Using Filters to Slice and Dice
To start slicing and dicing your data, open the relevant modules by clicking on the arrow on the right side of each module. In this example the Clouds module was chosen to drill down on specific cloud environments.
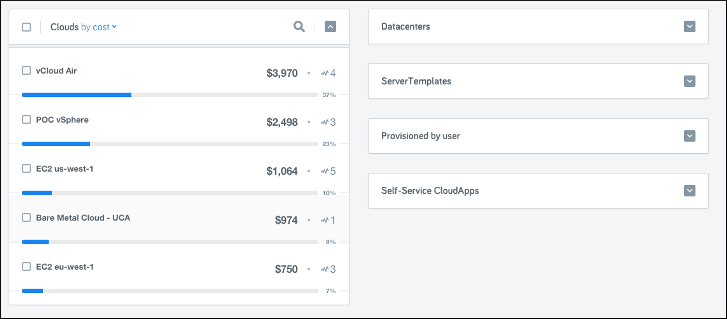
Check the box on the left hand side of the cloud that you want to analyze.
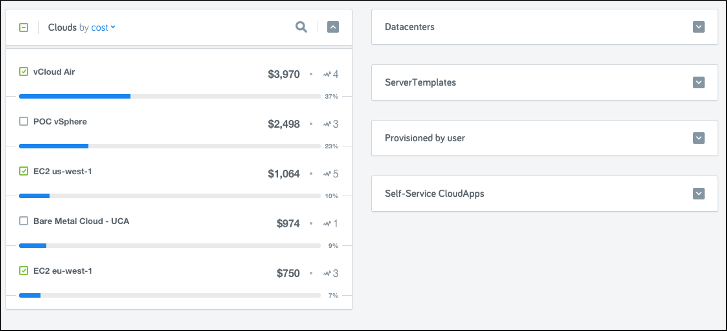
After you check your first items, you will notice the Apply Your Filter Selection button near the bottom of the screen. After you have checked the boxes for all relevant items, click this button to apply the filter selection.

You can see all of your selected filters at the top of the filter modules.
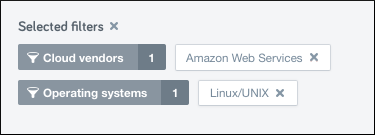
You can remove all of the filters by clicking the X next to Selected filters. Alternatively, you can remove each specific filter individually by clicking the X next to the name of that specific filter.
Sharing Analyses
Once you have create a set of filters and date range to analyze, the Share button to the left of the date range generates a “point in time” link for you to share with anyone you choose. Click the share button on the right of the link and then click the icon to copy the URL to your clipboard. Simply share the URL and other users that have access to these accounts can immediately jump to the same analysis. This is very helpful for collaborating with others to resolve questions on costs.

Using Analysis Filters for Forecasts, Reports and Alerts
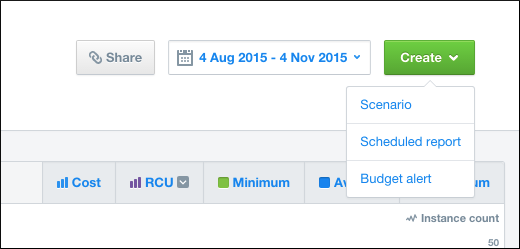
Once you have defined a set of filters on the Instance Analyzer, you can create a Scenario, Scheduled Report, or Budget Alert from this screen. Navigate to the top of the Instance Analyzer and click Create. This will direct you to the specific page, and retain the filters you have set on the Instance Analyzer.
Full Instance Details
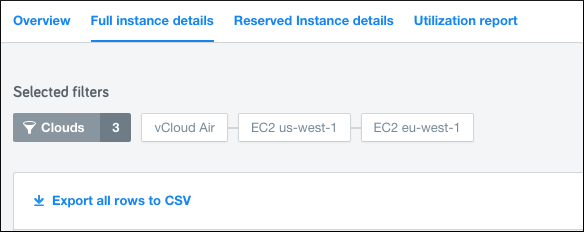
Click the Full Instance Details tab next to Overview to see full instance details across the already pre-selected filters. If you want to view full instance details of your whole environment, make sure you remove the filters before navigating to this screen.

This page that provides full instance information for all instances that match the filters you specified.

Use the Show/Hide columns link to customize the columns. Click a column header to sort the data by that column.
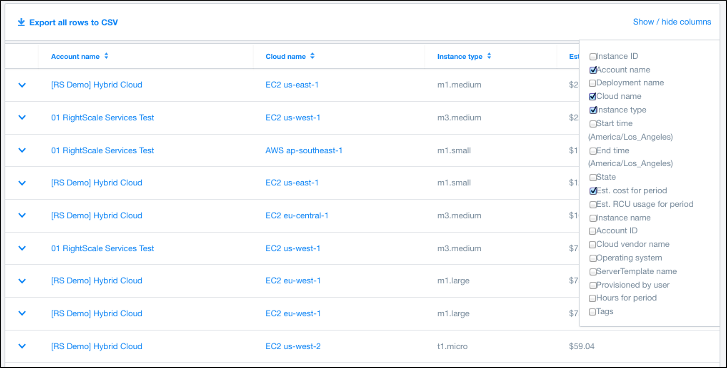
For instances that are currently running, you can click the Instance ID to link directly to that instance within RightScale Cloud Management. This enables you to take actions on a set of instances that you identify. For example, you may need to terminate “stranded” instances that are stuck while booting, change instance sizes for instances with low utilization or adjust instances to match Reserved Instances you’ve purchased on AWS. You can also go to clouds and accounts directly from their names on this table.
You can export the full instance information to a CSV if needed to further analyze using a spreadsheet or to integrate the data into other systems.
Reserved Instances
To view all types of AWS Reserved Instances (RI) including the utilization percentage, click on the Reserved Instances link on the left navigation of Optima. This page shows information about your RIs for the selected organization for a 7 day rolling window (starting 7 days back, ie over the last 7 days). If you belong to more than one RightScale organization, select the organization you want to view RI information on.
You need to have ca_user role at the organization level in RightScale to access this information.
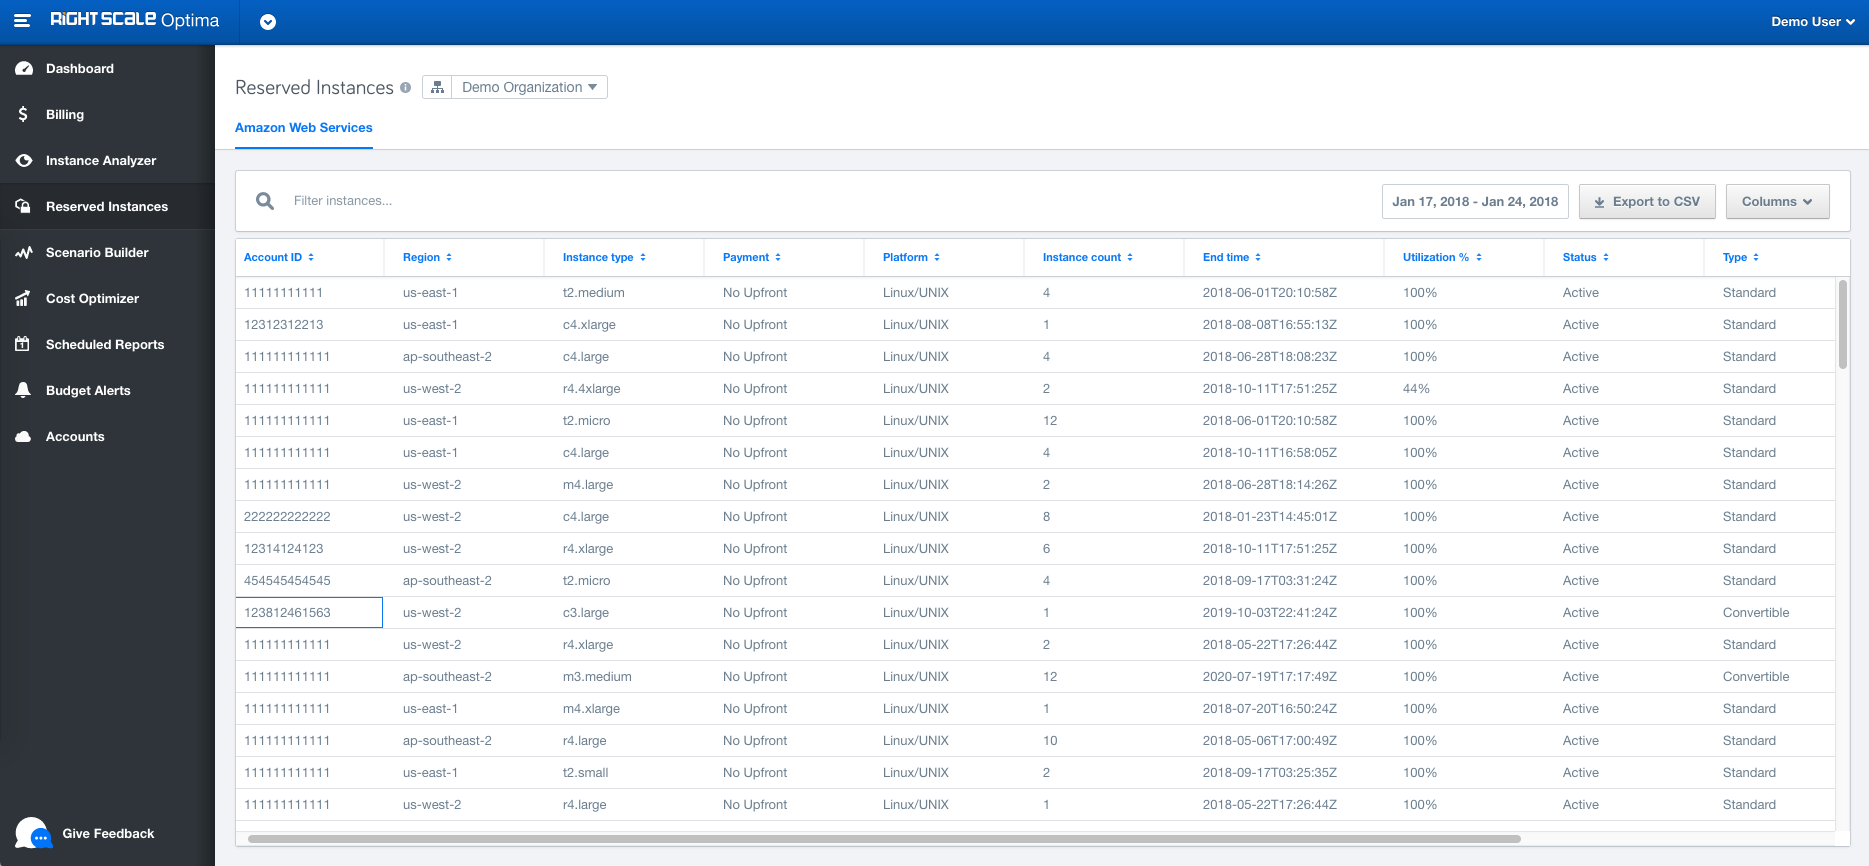
You can choose the columns you wish to see in your view by selecting the fields from the column picker. Click the Export to CSV button to download the information as a CSV including all columns (visible and hidden) in the table.
The information presented on this page is retrieved from the AWS Cost Explorer API. To fetch this data, the following IAM stanza needs to be added to the RightScale user's IAM policy on your AWS parent account. Find the complete policy details here.
{
    "Effect": "Allow",
    "Action": [
        "ce:GetReservationUtilization"
    ],
    "Resource": "*"
}