Our built-in monitoring features allow you to view detailed system data for each running server. For a complete description of each metric that is monitored, see the List of Monitored Metrics. The monitoring data is especially useful for analyzing your entire system or individual servers. Use the collected data to help choose which load/data metrics you will monitor in order to set up a scalable array. See How do I set up Autoscaling?.
You can view graphs of individual servers at the deployment or server level under the Monitoring tab. You can also view monitoring graphs at the Dashboard's home page (Home > Dashboard > Monitoring tab).
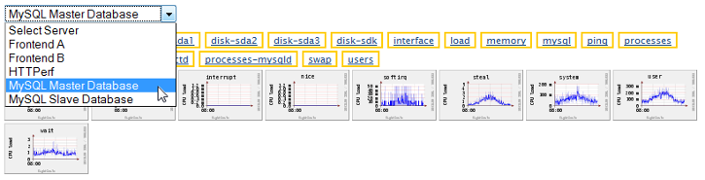
Select a Server
For this example, go to an individual deployment with running servers and click the Monitoring tab. At the deployment level, you can select any server in your deployment that you would like to view. The types of graphical data that display vary, depending on the type of server that you select (database, application server, etc.).
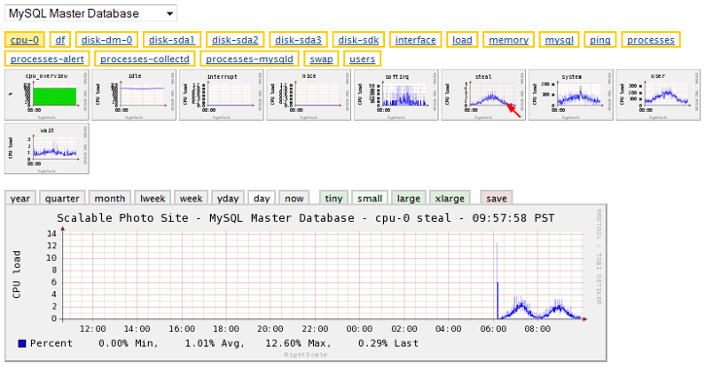
Select a type of Graph
Select the type of data metric that you would like to view (ex: cpu-0) and then click a thumbnail to see a larger version of the graph. By default, the graph displays the data for the day. Select the Now tab to view hourly real-time data.
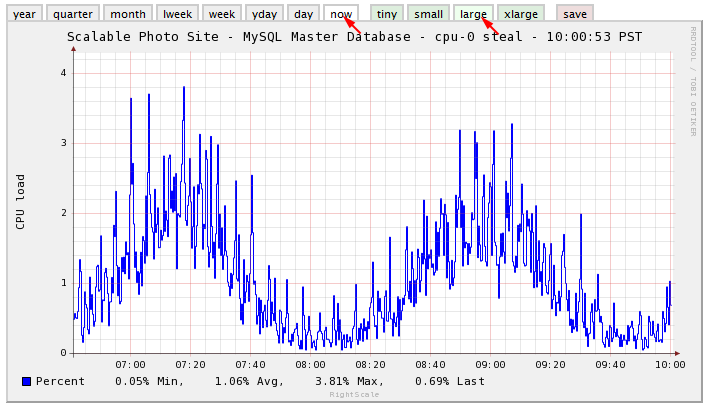
Resize the Graph
Use the time scale and graph size tiny, small (default), and large tabs to adjust the size of the graph.
Save the Graph
Click the Save tab to take a snapshot of the graph. When you save a graph it is preserved under the dotted line and preserve your time scale and size preference.
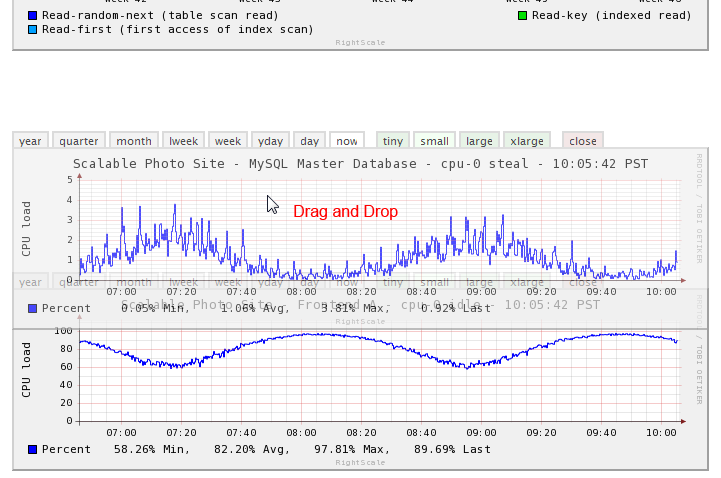
Rearrange the Graphs
If you've taken multiple snapshots of different graphs, you can rearrange the order by simply dragging and dropping the graph. The graph at the top is always a live
graph, not a saved graph.