Overview
Audit entries are created for virtually all actions, such as launching and terminating instances, as well as all commands that are executed on instances to perform operations such as bundling or performing database backups. The audit entries are kept for an extended amount of time after the actual event in order to provide a comprehensive history of your actions. You may sort by any item in the table, in ascending or descending order.
- Timestamp - A timestamp of when the action was performed. Date and time are based upon the time zone that's defined in your user settings (Settings > User Settings > Preferences). Click a timestamp to highlight any audit entries that were created at the particular time.
- Subject - The name of the server instance. For example, an EC2 instance ID or the server's nickname.
- User - If a user manually performed an action within the Dashboard, such as terminating an instance, the user's email will be listed. If an alert escalation triggered an action, such as an email or relaunching a server, the user will be alerter@rightscale.com. Otherwise it will be labeled
N/A
(not applicable). - Summary - View a detailed audit entry of the task. Useful for troubleshooting.
By default, the last 14 days are displayed. The Displays drop-down menu allows you to look at audit entries that are archived
and grouped quarterly. The most recent year's quarter is on top, the oldest available is on the bottom.
Actions
View Audit Entry Index Page
By default, when viewing Reports > Audit Entries the last 14 days are displayed. They are archived however, and the Displays drop-down menu allows you to look at Audit Entries in a quarterly grouping. (The most recent quarter/year on top, the oldest available is on the bottom.)
View Individual Audit Entries
Displays can be in one of two views:
- Structured View - More of a formatted view. This view is parsed and subsequently formatted, hence it is a bit more readable. It splits the details of an audit entry into audit entry records. You can expand/collapse the detailed entries for these records. For example, you can expand/collapse boot state or package installation entries with a simple mouse click. (Select the triangle next to the
Details
to either expand or collapse that portion of the Audit Entry.) - Raw Output View - Entire contents of the Audit Entry are passed through for viewing
as is
. The raw output is more exhaustive as it shows all of the output from the logs, not just the portions that were parsed and placed into a Structured View. In some instances, it is possible that Structured View contains slightly less data. Data that did not parse well will always be included with the raw output.
There are several ways to view audit information. Such as selecting the appropriate entry from any of these locations in the Dashboard:
- Navigate to Reports > Audit Entries
- Navigate to Manage > Deployments > YourDeployment > Audit Entries tab and select the appropriate entry link
- Navigate to Manage > Instances & Servers > YourSever > Audit Entries tab
- Select an Event from the left pane of the Dashboard (Events are similar to
Recent Activity
, which has been deprecated.)
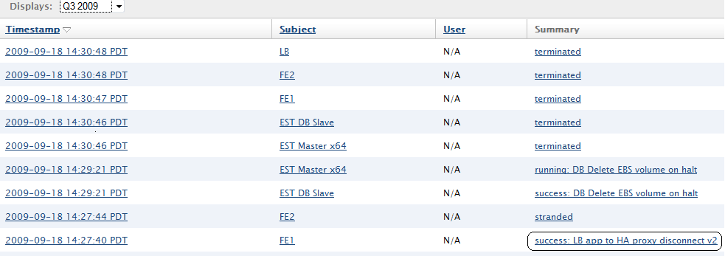
The following example screen shows the Reports > Audit Entries index (for a previous quarter):
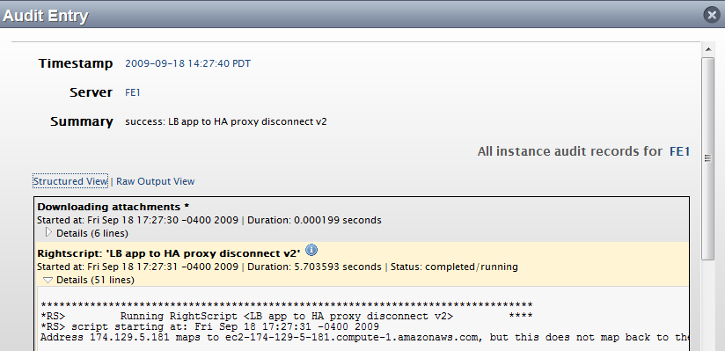
The following screen shows the Structured View of a specific entry from the Audit Entries report shown above (successful completion of a HAProxy disconnect RightScript):
Basic Troubleshooting Using Audit Entries
After obtaining a fundamental understanding of what Audit Entries are and how to view them, this tutorial manufacturers a fairly common glitch while launching a Server, and follows the Audit Entries as part of a basic troubleshooting effort. It is important to get the basic mechanics down first. Specific troubleshooting and debugging is tied to your Deployment configuration, application information, database, etc.
To demonstrate how you can use Audit Entries for troubleshooting purposes, the following steps will lead you through a common troubleshooting scenario—a “stranded” Server. In the first part of the tutorial, you will purposely strand a Server by modifying one of its Input parameters. In the second part, you will demonstrate how to use the audit entries to help diagnose the cause of the problem.
- Import the “Mephisto all-in-one” ServerTemplate from the MultiCloud Marketplace
- Add a Server to an existing Deployment using the imported “Mephisto all-in-one” ServerTemplate.
- Launch the Server
- Before you confirm the Server launch, change the value for the ‘SVN_APP_REPOSITORY’ Input. Enter a bogus value (e.g. blah-blah) and click Launch.
- After a few minutes, the Server will become “stranded” because the Server will not be able to find and download the web application.
- Click on the Audit Entries tab (or you can click the link in the Events pane).
- Click on the ‘stranded’ link to view more detailed information about the error.
- Next, you’ll see the detailed audit entry. Scroll down to the bottom and expand the details of the action that failed.
You should see entries that worked ok, and eventually one that fails. Does it align with what you expected to see? This is a fairly basic example, but it's a very common mistake. Entering an improper Input value is usually one of the main reasons why a Server will become stranded. It's important to realize that one of the first places you should look when you experience problems stranded servers or scripts that failed to run properly is the Audit Entries. Understanding how to read Audit Entries will be a critical part of any troubleshooting effort.