Overview
The Dashboard Users Guide provides technical end-user documentation on using the RightScale Cloud Management (CM) Dashboard.
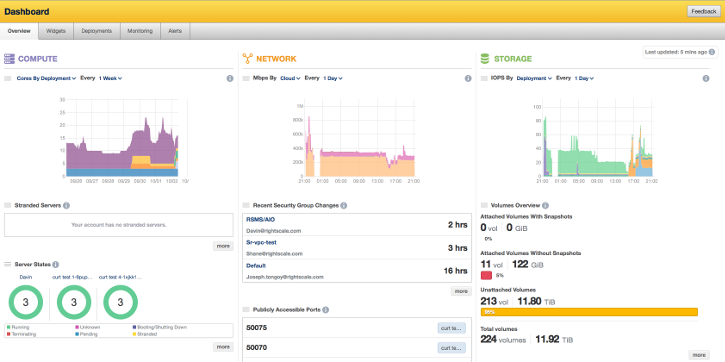
When you first launch the RightScale Cloud Management Dashboard you are presented with the Account Overview page. The Account Overview is divided into three parts: compute, network, and storage, that give you a near real-time overview of cloud resource activity allowing you to see at a glance what is currently happening in your account. From this view, you can navigate to other pages in the CM platform to take actions and resolve issues as needed. Here is an illustration showing a typical Account Overview page.
Using Account Overview you can...
- Ensure critical application infrastructure is healthy
- Identify network security issues
- Check for abnormal system behavior
- Verify underlying cloud performance
- Reduce costs by locating wasteful resources
The various components of the Account Overview page are described below.
Compute
The Compute component shows operational information related to the computing resources launched in cloud such as instance/core usage, stranded servers, server states, and alerts.
Compute Graph
At the top of the Compute component is a Compute Graph depicting instance/core usage by deployment/cloud over time. The Compute Graph is helpful in that it gives you a sense of your usage patterns and allows you to quickly determine if there has been any abnormal usage of your account. Using this information you can begin to answer questions such as "Does it make sense that I scale up in the evening every day?”. Using the available drop-down you can configure the graph to view Instances By Deployment (default), Instances By Cloud. Cores By Deployment , or Cores By Cloud. You can also specify the timeline axis to be either one day or one week. Hovering your mouse over the graph reveals the detailed breakdown of data at any point along the timeline.
Stranded Servers
Below the Compute Graph is a listing of the four most recent Stranded Servers across all deployments in your account. This allows to quickly deternine any potential problem areas. Each server name is listed along with the amount of time the server has been stranded. Clicking the More button displays a modal dialog where any additional stranded servers are shown (if any) along with details.
Server States
The Server States area shows the three largest deployments in your account. The various states of the servers in each deployment is depicted using a color-coded circle that also indicates the number of running servers. Links are provided to each deployment listed so you can easily navigate to them to address any concerns or gather additional information. Clicking the More button displays a modal dialog that shows a comprehensive listing of all deployments in your account along with the total number of servers in each deployment and each server state.
Active Alerts
The Active Alerts area shows the three most recently triggered alerts across all deployments in your account. For each alert listed, the instance name and alert condition is displayed along with the elapsed time since the alert first occured. A button is provided so you can quickly navigate to the associated server page to address issues as needed. Clicking the More button displays a modal dialog showing all triggered alerts and the associated server, deployment, alert condition, and alert age.
Active Alerts by Deployments
The Active Alerts by Deployments area shows all active alerts in your account, sorted by the deployment with the most active alerts. Color-coding shows the alert classification (critical, warning, other) and a link to the alerts tab of the displayed deployment is provided for ease of navigation.
Network
The Network component displays operational information related to network performance, security groups, and ports.
Network Graph
At the top of the Network component is a Network Graph showing network traffic in Megabits/second (Mbps) by deployment/cloud. The graph includes all network transmission across all deployments in your account including both inbound and outbound traffic. The Network Graph can aid you in identifying network traffic patterns and locating chatty services/traffic that may be needlessly increasing costs. Using the available drop-down you can configure the graph to view Mbps by Deployment (default) or Mbps by Cloud. You can also specify the timeline axis to be either one day or one week. Hovering your mouse over the graph reveals the detailed breakdown of data at any point along the timeline.
Recent Security Group Changes
Below the Network Graph is a listing of Recent Security Group Changes which shows who made the most recent changes to security groups used in the account. This helps you maintain security by ensuring only authorized users are making network changes. Each changed security group is listed along with the responsible user and the elapsed time since the change was made. Links are provided so you can quickly navigate to the associated security group page. Clicking the More button brings up a comprehensive list of all security groups and when they where last changed.
Publicly Accessible Ports
The Publicly Accessible Ports area shows all ports open to the internet and in which deployments they are used. The listing includes up to 15 ports in reverse order that are open to all IP addresses. These ports are in one or more security groups that are in use in one or more of the deployments in your account. This list helps you verify that only known ports are actually open and provides a quick way to make sure nobody entered a CIDR port incorrectly. For each port listed, one or more buttons take you to the corresponding deployment page(s).
Storage
The Storage component displays operational information related to the data storage resources accessible in your account.
Storage Graph
At the top of the Storage component is a Storage Graph showing total IOPS (disk input/output operations - a measure of disk performance) by deployment/cloud across your account. Using the Storage Graph you can verify expected disk performance at-a-glance. Using the available drop-down you can configure the graph to view IOPS by Deployment (default) or IOPS by Cloud. You can also specify the timeline axis to be either one day or one week. Hovering your mouse over the graph reveals the detailed breakdown of data at any point along the timeline.
Volumes Overview
Below the Storage Graph is the Volumes Overview where you can view a high level summary of the storage volume usage in your account. This helps ensure that you are not overspending on storage volumes you do not use. Volume usage is broken down into Attached Volumes With Snapshots, Attached Volumes Without Snapshots, Unattached Volumes, and Total Volumes. Clicking the More button displays a modal dialog showing a comprehensive list of all storage volumes in your account along with size, age, and other meaningful data.
Attached Volumes Without Snapshots
The Attached Volumes Without Snapshots area shows the most recently created volumes without snapshots. This information helps you ensure your disaster recovery plan is viable by making sure new volumes are getting snapshotted appropriately. Each volume listed is linked for convenient navigation to the corresponding page in CM. The age of each volume without a snapshot is also indicated. Clicking the More button displays a modal dialog showing a comprehensive list of all attached storage volumes without snapshots in your account along with size, age, and other meaningful data.
Unattached Volumes
The Unattached Volumes area shows the most recently created volumes in your account that are not attached to a server. This information helps you identify wasteful volumes that are being utilized. Each volume listed is linked for convenient navigation to the corresponding page in CM. The age of each unattached volume is also indicated. Clicking the More button displays a modal dialog showing a comprehensive list of all unattached storage volumes in your account along with size, age, and other meaningful data.